Big Bend Seagrasses Aquatic Preserves (BBSAP) is made up of two aquatic preserves and is responsible for managing approximately 1,000,000 acres of submerged lands. BBSAP hosts the second largest contiguous seagrass meadow in the eastern Gulf of Mexico. Seagrass improves water clarity by stabilizing bottom sediments, absorbing nutrients from the water column, reducing coastal erosion, and providing critical habitat for juvenile fish, invertebrates, and commercial and recreational fisheries. The estuarine waters of these two aquatic preserves also host mangrove, salt marsh, and hardbottom habitats, creating rich biodiversity. Data sondes have been operating in BBSAP since 2004, but there are currently only two active stations. BBSST02 (Steinhatchee) is located in Big Bend Seagrasses Aquatic Preserve and was established in November 2025. BBSCH (Chassahowitzka) is located in St. Martins Marsh Aquatic Preserve and was established in July 2018.
BBSAP - The Big Bend Seagrasses Aquatic Preserve was established in 1985. Its boundaries extend from the Withlacoochee River north to the St. Marks River and includes all tidal lands, islands, seagrass beds, shallow banks, and submerged bottoms from the mean high-water line out nine nautical miles. Numerous estuaries, which nurture a diverse flora and fauna, are formed at the confluence of the many rivers and streams that flow into BBSAP. Open waters and submerged bay bottoms of these estuaries provide habitat to a wide variety of sea and shore birds. This region supports a very important commercial shellfish industry including Cedar Key clams, scallops, oysters, pink shrimp, and blue crab. Currently, one station is operating, BBSST02 (Steinhatchee), but historical sites include BBSST (Steinhatchee), BBSCK (Cedar Key), BBSBC (Bennett Creek), BBSWT (Withlacoochee), BBSSK (Seahorse Key), BBSDB (Dekle Beach), and BBSSW (Suwannee).
| Station code |
Name |
Dates available |
| BBSBC* |
Bennett Creek |
01/09/2004 to 07/22/2016 |
| BBSWT* |
Withlacoochee |
01/09/2004 to 06/24/2016 |
| BBSSK* |
Seahorse Key |
04/07/2004 to 04/26/2015 |
| BBSDB* |
Dekle Beach |
03/07/2007 to 02/13/2016 |
| BBSSW* |
Suwannee |
03/12/2009 to 07/27/2016 |
| BBSST* |
Steinhatchee |
10/28/2019 to 09/30/2024 |
| BBSST02 |
Steinhatchee |
11/05/2025 to 03/31/2026 |
| BBSCK* |
Cedar Key |
02/20/2023 to 10/31/2023
|
SMMAP - The St. Martins Marsh Aquatic Preserve was established in 1969. It is composed of
approximately 28,400 acres of open water, several inlet bays, tidal rivers and creeks, salt marsh,
and adjoins upland hammock islands. Nutrient
exchange between the marshes and the Gulf of
Mexico make the salt marsh a significant area of
primary production and a nursery ground for many
fish species. The Springs Coast is characterized by
unique limestone outcroppings and exposed karstic
features. Habitats associated with these areas are
seagrass meadows and hardbottom. Currently one station is operating, BBSCH
(Chassahowitzka), but historical sites include BBSCR (Crystal River), BBSKB (Kings Bay), and
BBSHS (Homosassa River).
| Station code |
Name |
Dates available |
BBSCR* |
Crystal River |
01/08/2004 to 01/13/2015 |
| BBSKB* |
Kings Bay |
01/08/2004 to 07/22/2016 |
| BBSHS* |
Homosassa River |
01/09/2004 to 07/12/2016 |
| BBSCH |
Chassahowitzka |
07/06/2018 to 03/31/2026 |
Aquatic Preserve Description
Matlacha Pass Aquatic Preserve, located in Lee County, Florida was designated as an aquatic preserve in 1972. It comprises approximately 14,622 acres of submerged lands. Distinguishable by its dark, tannin-stained waters, the preserve is located between Charlotte Harbor to the north and the Caloosahatchee River and San Carlos Bay to the south. It is shaped in a sinuous channel that winds among oyster bars, mangrove islands and seagrass flats. The three sites were selected to monitor the extent of the tidal node in Matlacha Pass Aquatic Preserve in addition to the tidal influence of the Caloosahatchee River, Charlotte Harbor and runoff from adjacent Cape Coral and Matlacha. Eight different water quality parameters are collected every 15 minutes at each of the stations.
Datalogger Site Description
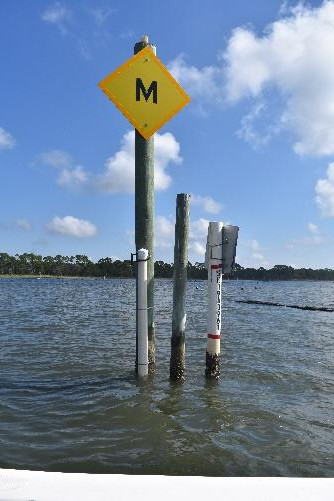
MP1A - Station MP1A is the most northern of the three datasonde sites, located north of channel marker #76. The station is located on a CHAP permitting piling and sign. MP1A was established in September 2005. The monitoring site is influenced by Charlotte Harbor and is approximately 0.75 km SW of Bird Rookery Keys and 1.1 km east of Pine Island. At the sampling site, the depth is approximately 1.3m at mid tide. Historical range of salinities at this site are 5 ppt to 34 ppt and fluctuate seasonally and daily with tides, wind, rainfall, and runoff. The substrate is predominantly fine sand and there is seagrass (Halodule wrightii and Thalassia testudinum) adjacent.
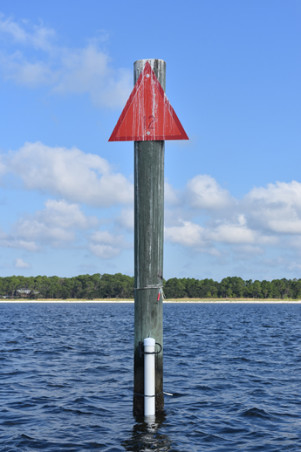
MP2B - Station MP2B is the southern most of the three datasonde sites, located west of channel marker #29, on a CHAP permitting piling and sign. MP2B was established in September 2005. The site is influenced primarily by waters from San Carlos Bay and the Caloosahatchee River. At the sampling site, the depth is approximately 2.0m at mid tide. Historical range of salinities at this site are 2 ppt to 36 ppt and fluctuate seasonally and daily with tides, wind, rainfall, and freshwater discharge. The substrate is predominantly fine sand and there is seagrass (Halodule wrightii) adjacent.
MP3C - Station MP3C is located in the middle portion of Matlacha Pass, just south of the drawbridge on the west side of the main channel. MP3C was established in March 2009. The monitoring site is influenced by a conflux of waters from nearby Matlacha, Cape Coral (from the Spreader Waterway canal), Charlotte Harbor to the north and San Carlos Bay and the Caloosahatchee River to the south. At mid-tide, the depth is approximately 2.0m. Historical range of salinities at this site are 2 ppt to 36 ppt and fluctuate seasonally and daily with tides, wind, rainfall, and freshwater runoff and discharge. The substrate is more of a loamy mucky sediment with oyster clumps.
| Station code |
Name |
Dates available |
| MP1A |
MP1A |
09/26/2005 to 04/15/2026 |
| MP2B |
MP2B |
09/26/2005 to 04/15/2026 |
| MP3C |
MP3C |
03/26/2009 to 04/15/2026 |
Aquatic Preserve Description
Central Panhandle Aquatic Preserve (CPAP), located in Northwest Florida, is responsible for the management of four Aquatic Preserves: Alligator Harbor Aquatic Preserve (14,366 acres), Apalachicola Bay Aquatic Preserve (80,000 acres), St. Andrews Bay (25,000 acres), and St. Joseph Bay Aquatic Preserve (73,000 acres). CPAP began monitoring one station in the St Joseph's Bay system beginning in July 2005 at the Richardson's Hammock station. Station Windmark in St Joseph's Bay was added in August 2006 and discontinued September 2007. In October 2007 the Alligator Harbor datalogger site was added to the program. St. Joseph Bay Aquatic Preserve is unique in being the only body of water in the eastern Gulf of Mexico that is not influenced by the inflow of fresh water. This allows for clearer coastal waters with sandier sediments than in the north central Gulf of Mexico, making the bay an ideal habitat for seagrass communities. Alligator Harbor is a shallow system with consistent salinity levels and little freshwater flow which does not create the estuarine conditions characteristic of the waterbodies lying to the west, however the preserve contains seagrass habitat, oyster bars, beaches, saltmarshes, and bottom communities. The Apalachicola Bay Aquatic Preserve is located within the Apalachicola National Estuarine Research Reserve boundaries, and to avoid duplicative efforts, CPAP currently does not have dataloggers located in the Apalachicola Bay Aquatic Preserve. There are currently no datalogger stations in St. Andrews Bay Aquatic Preserve. CPAP is in the process of identifying additional dataloggers locations for St. Joseph Bay and St. Andrews aquatic preserves.
Datalogger Site Description
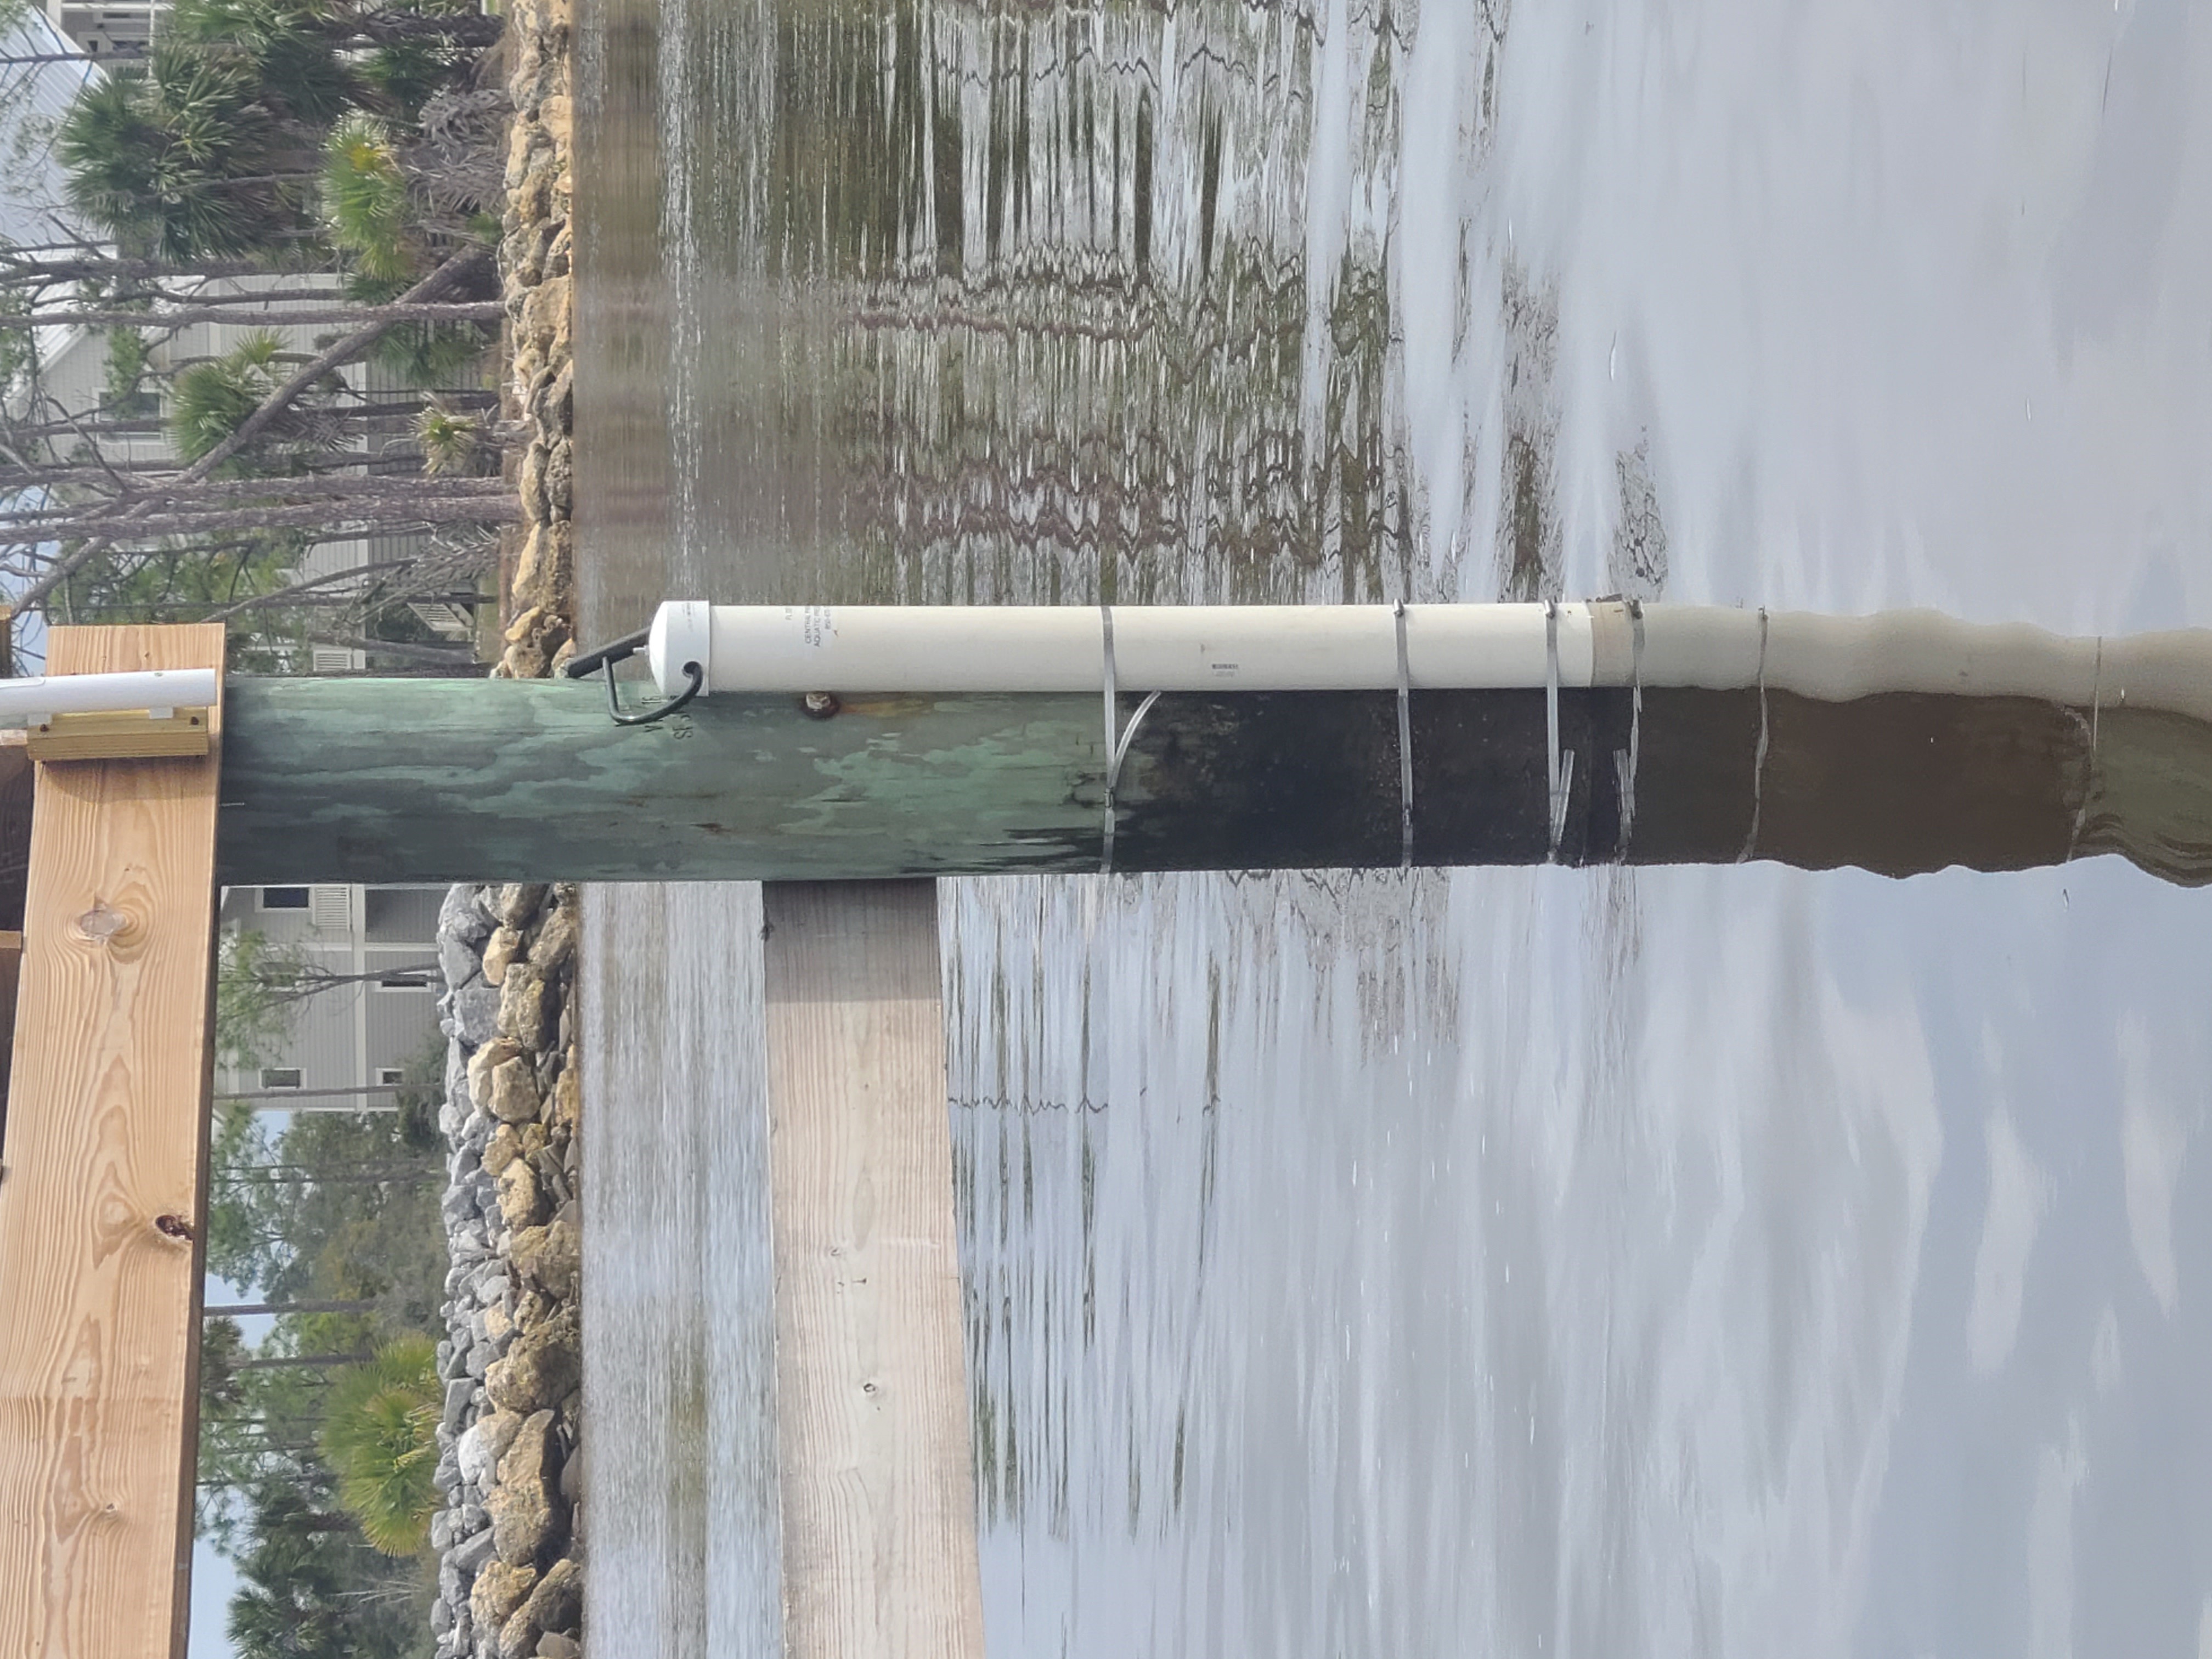
Alligator Harbor (AH2) - Alligator Harbor is centrally located on a piling in the aquaculture leases in Alligator Harbor (29.91813, -84.40969). The site is located on the southeast coast of Franklin County just east of the Apalachicola estuary. The actual harbor is approximately 4,045 acres and is a shallow system with sandy/muddy substrate. Little freshwater flow into the harbor creates stable salinity and limits the estuarine characteristics compared to the waterbodies lying to the west; however, the seagrass habitat, oyster bars, beaches, saltmarshes, and bottom communities found associated with Alligator Harbor Aquatic Preserve make it a productive and integral part of the marine ecosystem in the Franklin County area. Aquatic preserve staff maintained a datalogger in Alligator Harbor at a separate location from October 2007 through August 2008.
FSUCML Channel (FS) - The FSUCML Channel is located on a channel marker that is owned and maintained by the Florida State University Coastal and Marine Laboratory. This station is located on the western side of Alligator Harbor Aquatic Preserve and exhibits strongly estuarine characteristics; however, freshwater inputs and stormwater runoff create brackish conditions at times. Sandy substrate, salt marsh, oyster beds, and seagrass beds are common habitat features in and adjacent to this area. This station was installed September 2019.
Windmark (WD) - The Windmark datalogger station is located North of the Port St. Joe shipping channel. The sonde is housed at the end of a dock of a private residence. It is important to monitor water quality conditions at this location, since the shipping channel has been considered a major cause of turbidity and salinity fluctuations in St. Joseph Bay. To accurately assess the impacts of the shipping channel on St. Joseph Bay, the establishment of baseline water quality data sets is imperative. This station began deployment in March of 2021. Is located less than 400 m from the historical Windmark site (WM).
| Station code |
Name |
Dates available |
| CPAH* |
Alligator Harbor |
10/24/2007 to 08/25/2008 |
| CPAH2 |
Alligator Harbor 2 |
09/12/2019 to 03/31/2026 |
| CPFS |
Florida State University and Marine Lab |
09/12/2019 to 07/25/2023 |
| CPRH* |
Richardson's Hammock |
07/26/2005 to 05/10/2011 |
| CPWM* |
Windmark |
08/04/2006 to 09/14/2007 |
| CPWD |
Windmark |
03/01/2021 to 03/31/2026 |
Aquatic Preserve Description
Indian River-Malabar to Vero Beach Aquatic Preserve was designated on October 21, 1969 and is approximately 28,000 acres of shallow coastal estuary within the Indian River Lagoon (IRL).The Indian River- Malabar to Vero Beach Aquatic Preserve is located on the east coast of Florida in Brevard and Indian River Counties. The IRLAP (formerly East Central Florida Aquatic Preserves) water quality program collects water quality data for the St. Sebastian River at four permanent stations. 4,000 plant and animal species make their home in the IRL, of which 50 are threatened or endangered. The commercial and recreational fisheries (based on estuarine-dependent species) in the Indian River are some of Florida's most important - over 100,000 saltwater anglers are registered in the area.
Datalogger Site Description
IRC54 (C-54) - The Fellsmere Canal functions to keep storm water away from the city of Fellsmere. C-54 Canal was created to drain excess water off agricultural lands to the west. The Sebastian River now receives water that would have drained into the St. Johns River. The C-54/Fellsmere Canal datasonde is attached to an abandoned USGS water quality station. This station is accessible by car and kayak.
Donald McDonald/South Prong (IRDM) - The South Prong/Donald McDonald datasonde is attached to a piling at Donald McDonald Park’s educational overlook. This station is accessible by truck and kayak.
North Prong (IRNP) - The North Prong datasonde is attached to buffer preserve’s canoe landing and is accessible by ATV.
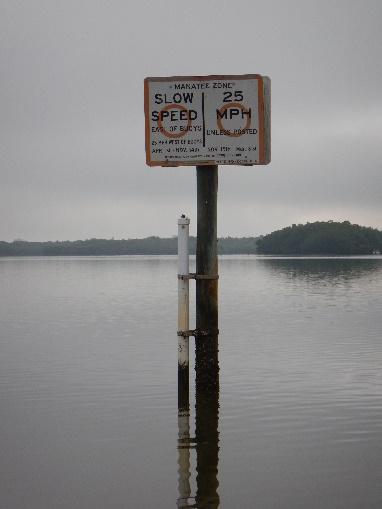
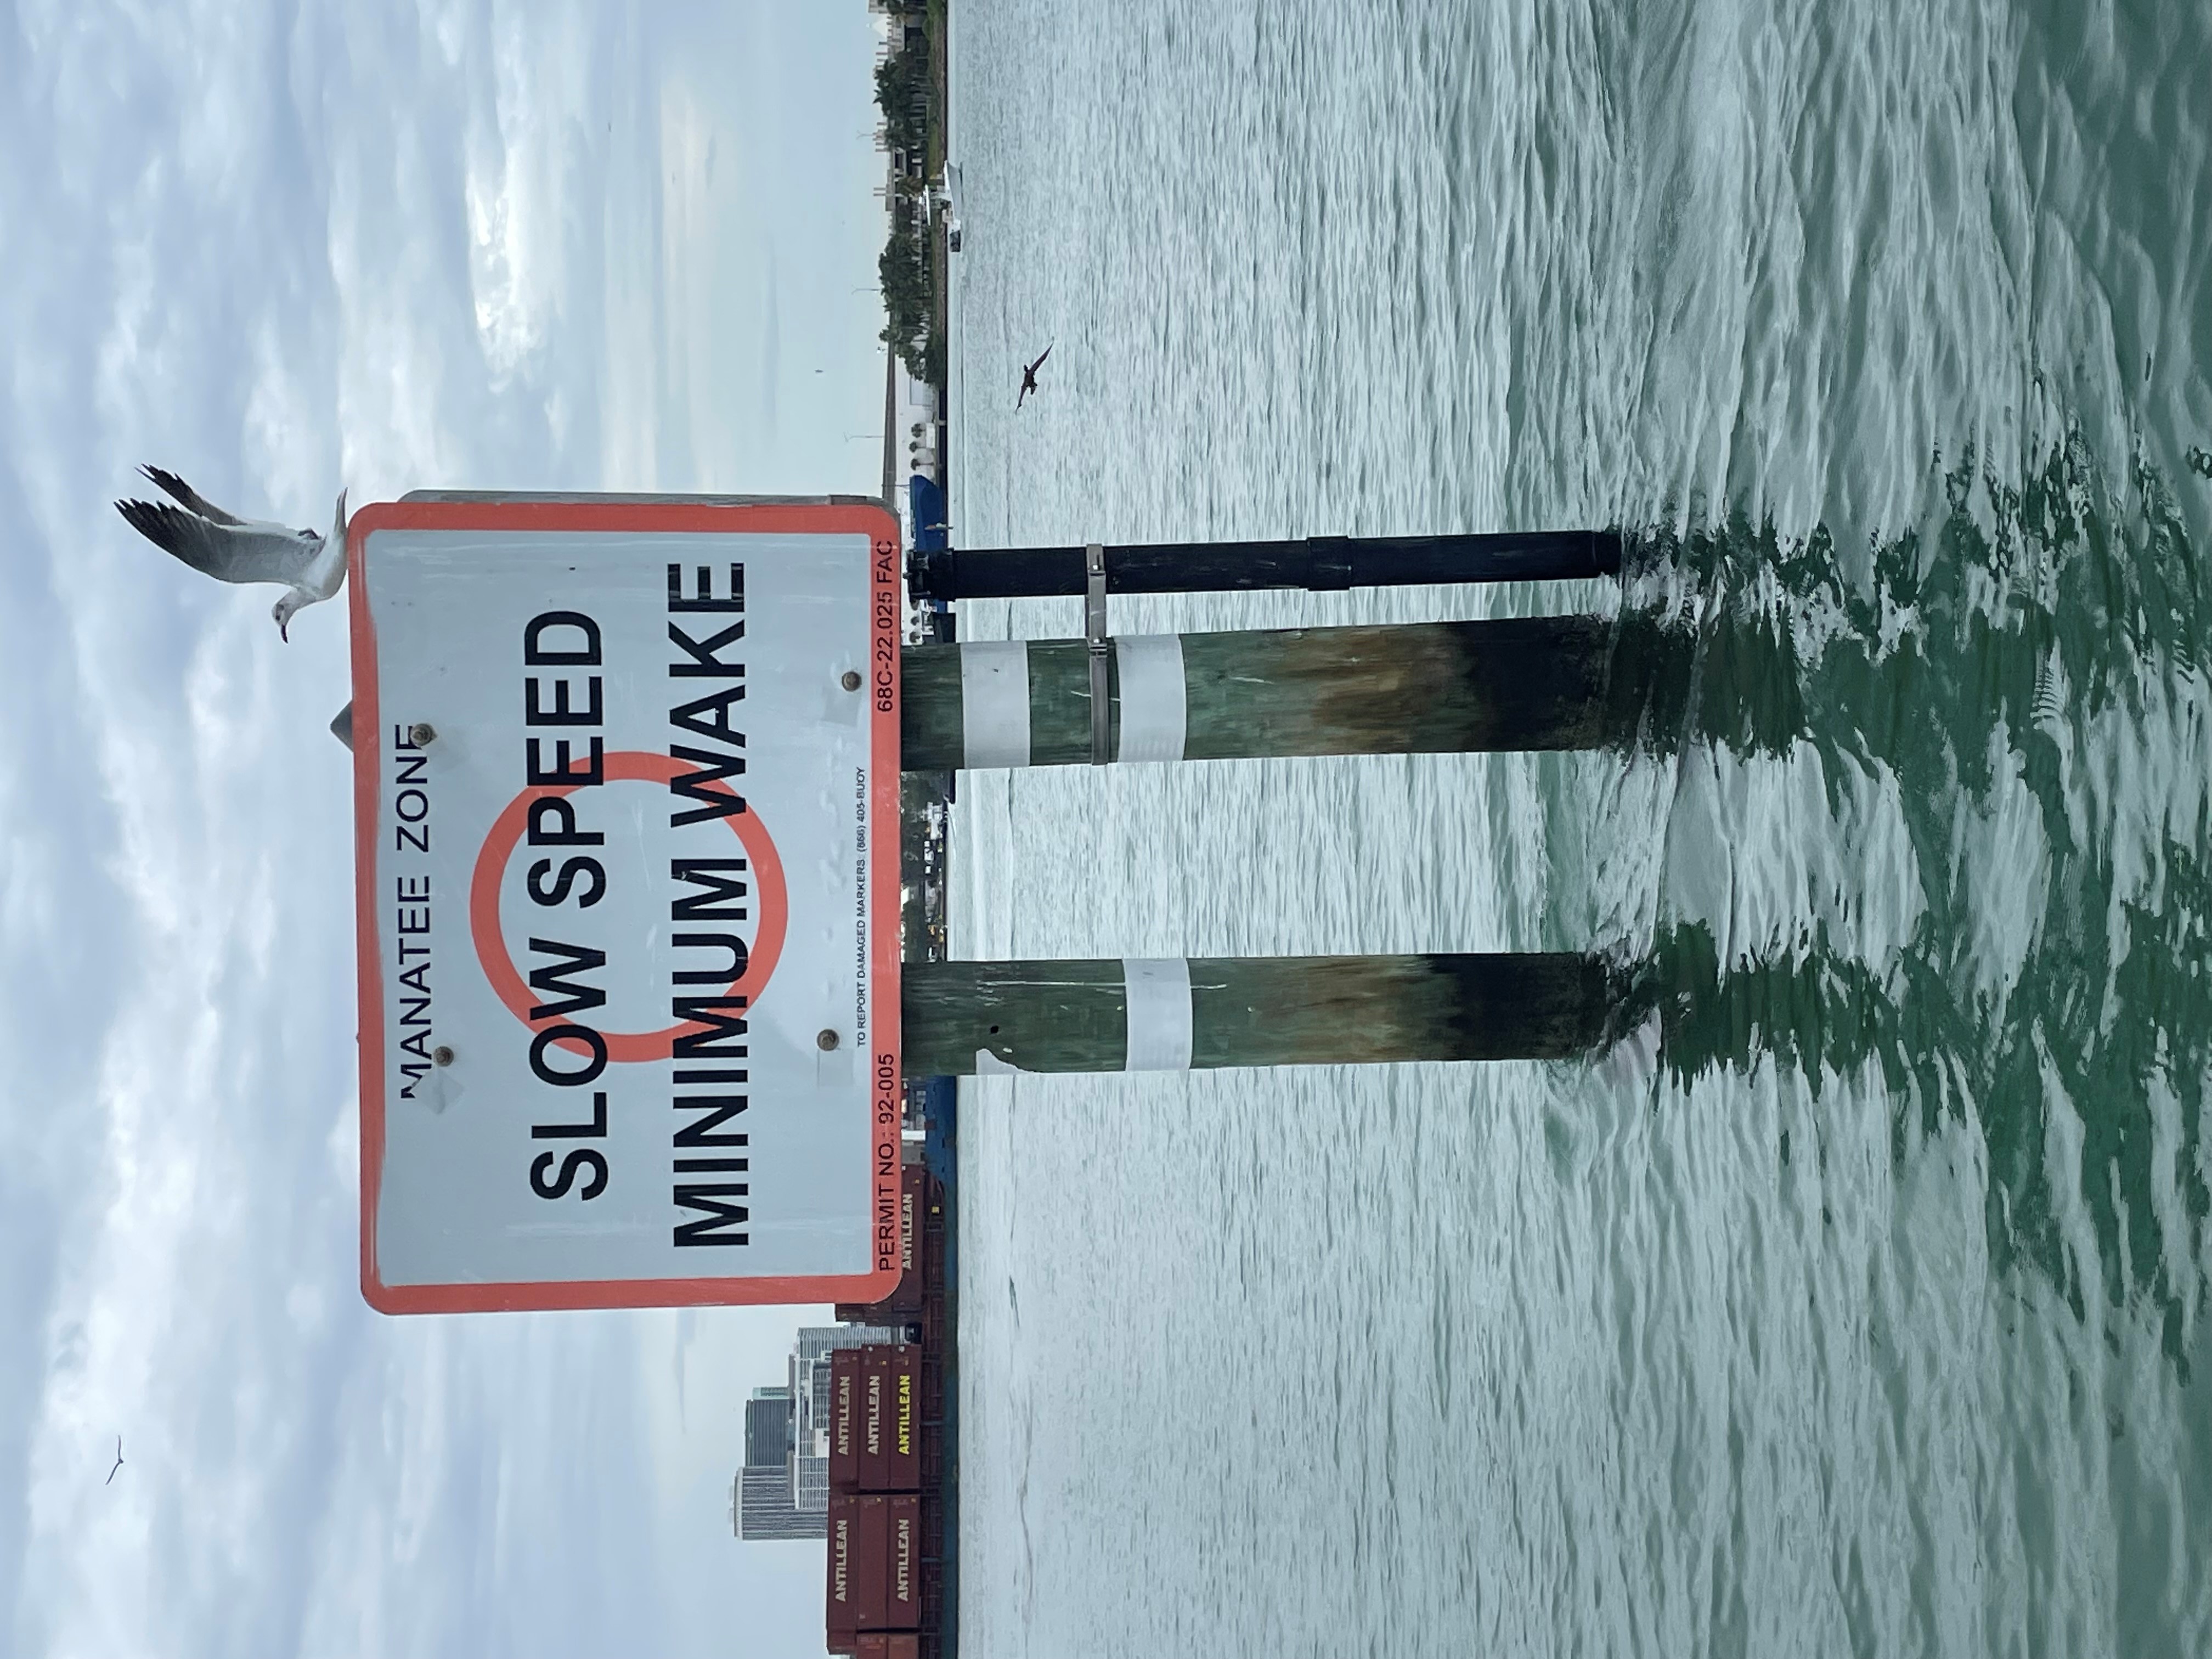
US 1 (IRUS1) - The Main Drainage Basis/US1 datasonde is attached to a manatee slow speed zone piling and is accessible by kayak or boat.
| Station code |
Name |
Dates available |
| IRC54* |
C-54 |
09/19/2003 to 07/02/2007 |
| IRDM* |
Donald McDonald/South Prong |
09/19/2003 to 04/18/2007 |
| IRNP* |
North Prong4 |
09/19/2003 to 05/21/2008 |
| IRUS1* |
US 1 |
09/19/2003 to 01/07/2008 |
Aquatic Preserve Description
Estero Bay Aquatic Preserve (EBAP) is Florida’s first aquatic preserve and encompasses over 11,000 acres. Local citizens and fisherman worked for its protection through a local grass-roots effort in Lee County, FL. Their goal was to protect Estero Bay’s natural resources from development occurring in nearby areas. Estero Bay remains a unique estuary in that it receives freshwater inflow from five minor tributaries and saltwater inflow through several passes as the bay is separated from the Gulf of Mexico by a chain of barrier islands. The bay’s many mangrove islands and submerged lands, which include seagrass meadows, oyster reefs, and tidal mudflats, are invaluable to the organisms that reside within them as well as to the economics of southwest Florida. Datasondes have been deployed at three locations for 8 parameters every 15 minutes since 2004. The goals of this program are to establish baseline water quality; evaluate daily, seasonal and long-term trends; and to quantify the effects of storm events and hydrological changes. The data is used for assessing water quality over time in order to prevent further degradation, to aid in interpreting changes observed in indicator organisms, and to make geographical habitat comparisons.
Datalogger Site Description
EB01 - EB01 is located between Estero Island and Julies Island in Matanzas Pass and is the most northern location. The channel substrate is predominantly fine sand with no bottom vegetation. Estero Island’s shoreline is hardened with sea walls; however, Julies island and others nearby are dominated by red and black mangroves. Land to the north of the site contains a significant amount of protected state-owned land—the Estero Bay Preserve State Park. The waters here are part of a null zone formed from the waters incoming from Matanzas Pass and Big Carlos Pass with some influence from Hendry and Mullock Creeks (approximately 5.1 km northeast of the sonde location). The average depth at this location is 2.05 meters at mean high-water line.
Julies Island (EB01B) - EB01B is located between Estero Island and Julies Island in Matanzas Pass. The deployment tube is attached to a Manatee Speed Zone marker. This station is within 200m of the EB01 station that was decommissioned after Hurricane Ian in 2022. This station replaces that one. The substrate is predominantly sand. Shoal grass grows in the sediment and collects some drift algae. Estero Island’s shoreline is hardened with sea walls; however, Julies island and others nearby are dominated by red and black mangroves. Land to the north of the site contains a significant amount of protected state-owned land—the Estero Bay Preserve State Park. The waters here are part of a null zone formed from the waters incoming from Matanzas Pass and Big Carlos Pass with some influence from Hendry and Mullock Creeks (approximately 5.1 km northeast of the sonde location). The average depth at this location is approximately 1.5 meters at MHW.
EB02 - EB02 is located northwest of the mouth of Spring Creek and south of Coconut Point. It is affixed to a navigational marker within the Spring Creek access channel. The substrate within the channel is a mixture of sand and silt with no bottom vegetation but seagrass in the vicinity. Nearby shorelines are dominated by red and black mangroves. The major freshwater inflow influencing this site is Spring Creek and the saltwater influx comes through New Pass. The average depth at this location is 1.7 meters at mean high-water line. This site is located near several active rookery islands, including one critical wildlife area, as well as several seagrass meadows, including one designated as a No Internal Combustion Motor Zone (NICMZ).
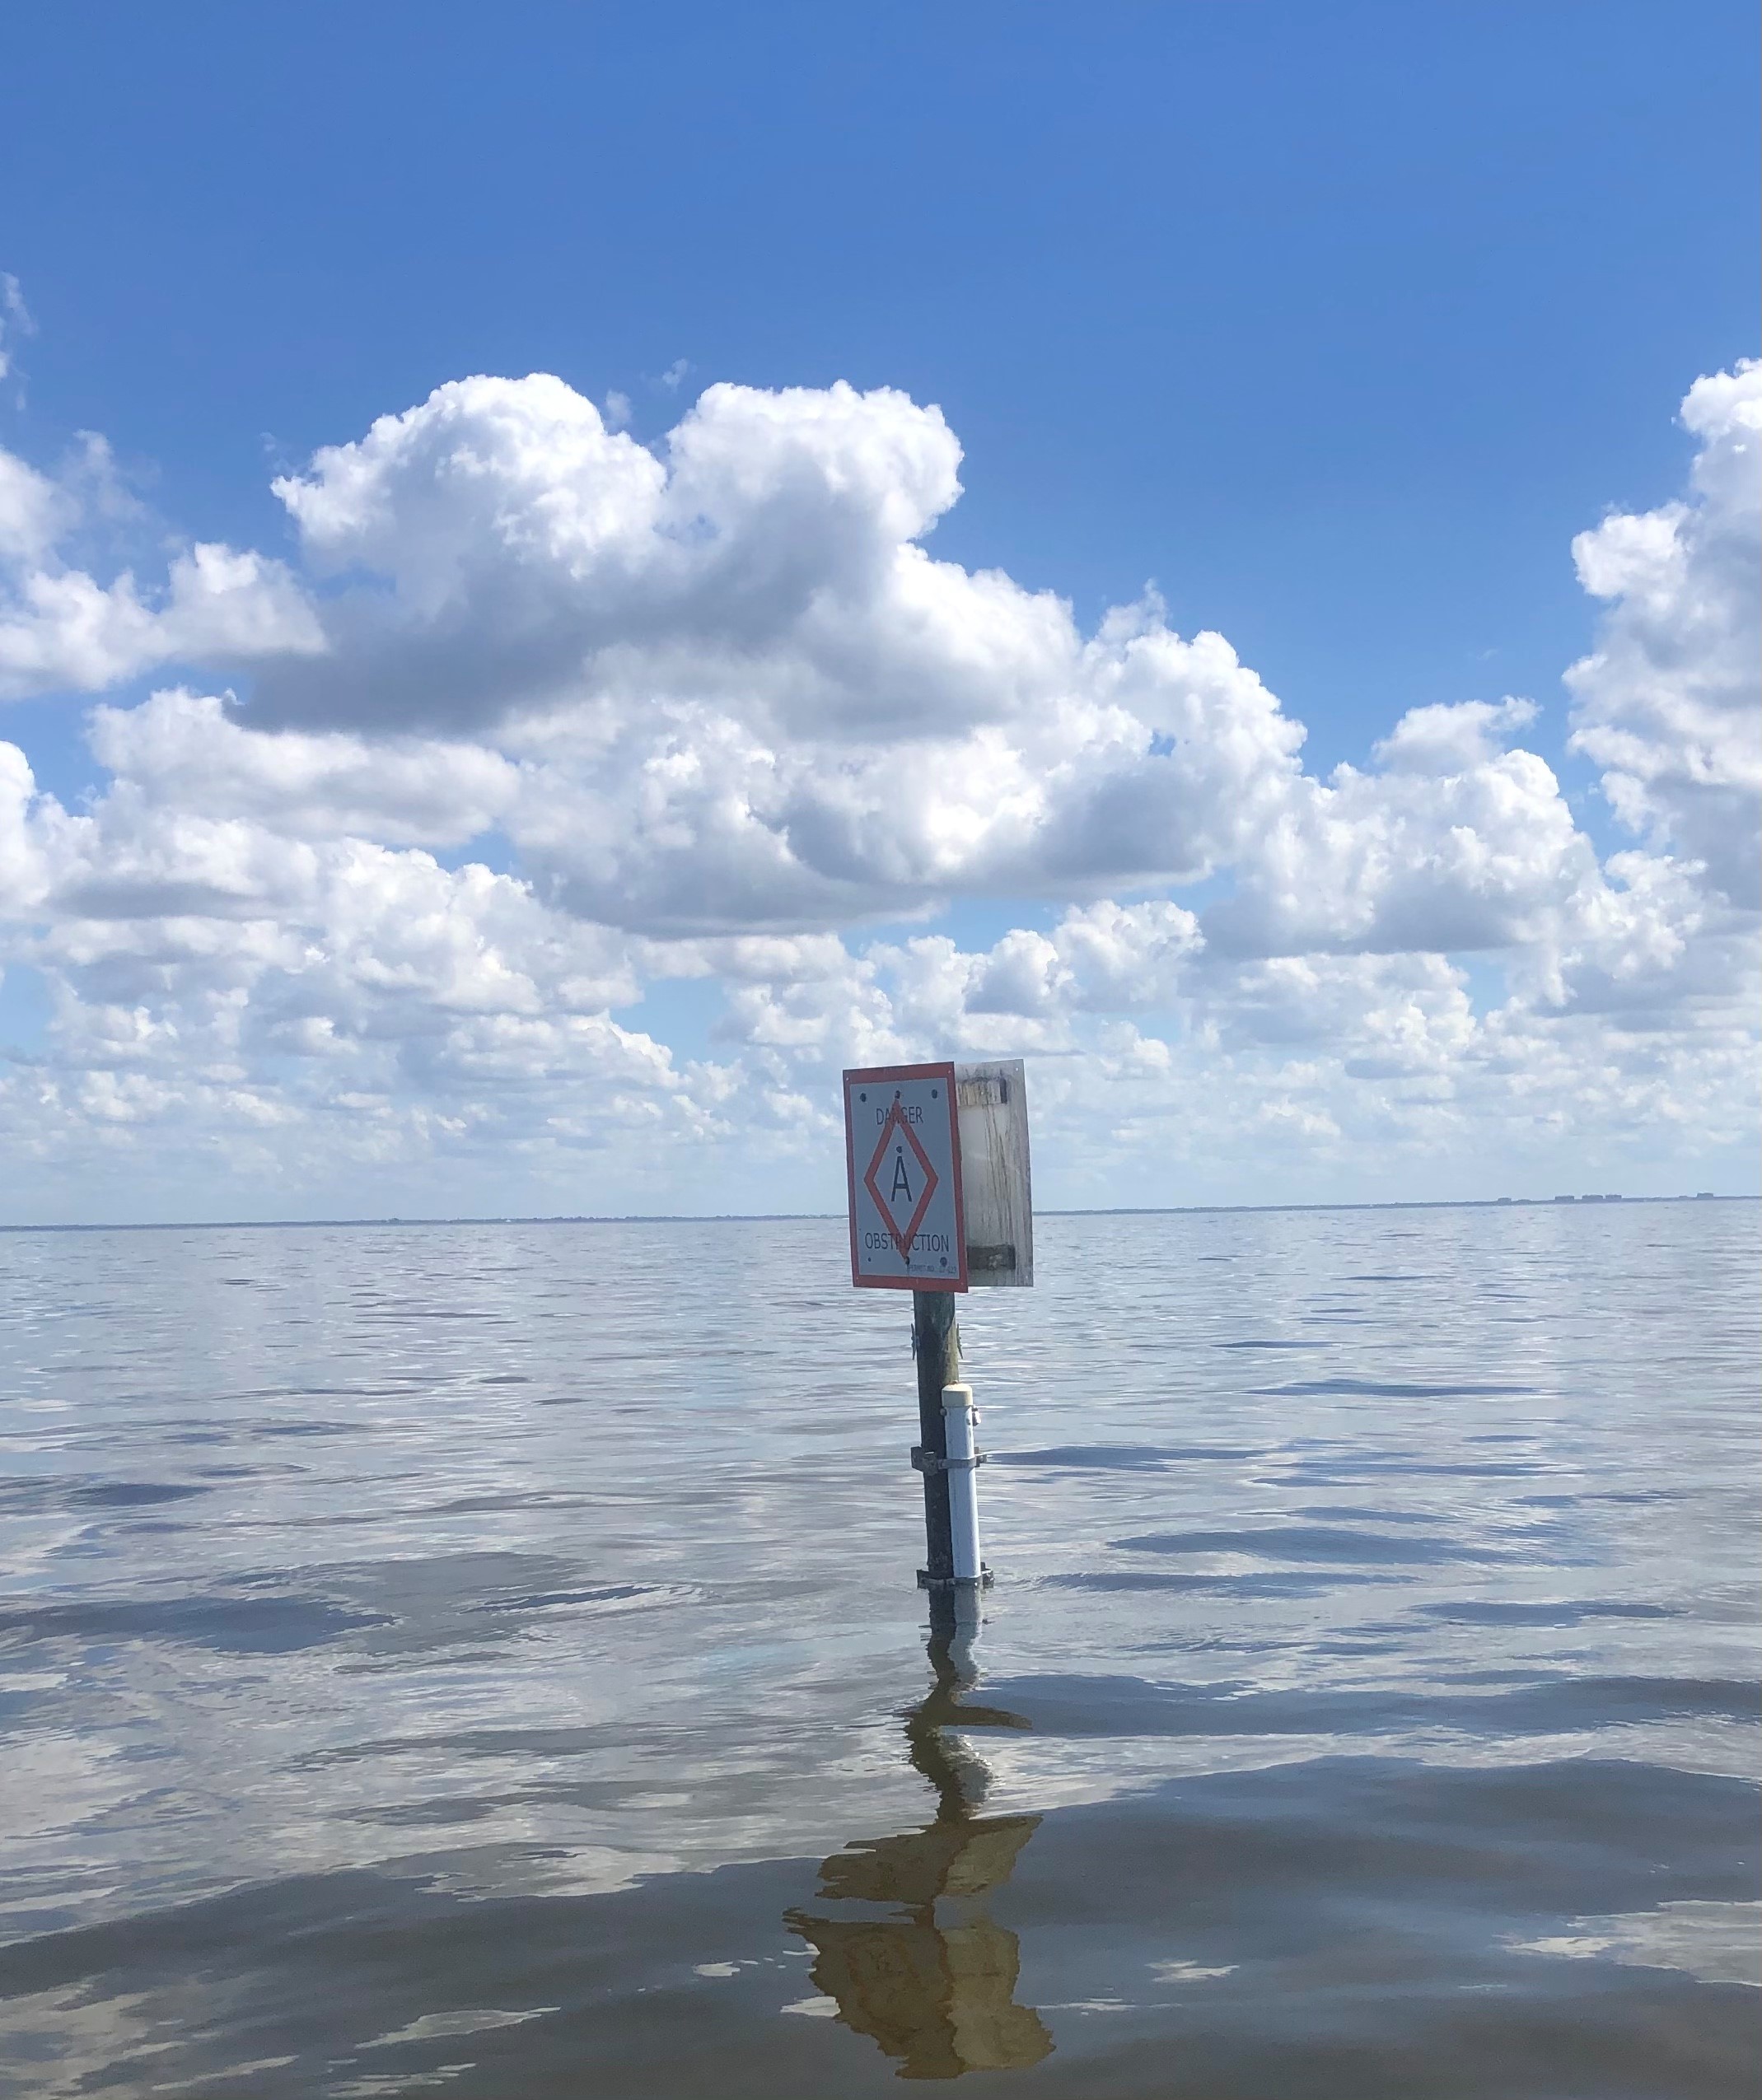
EB03 - EB03 is located in the southern portion of the aquatic preserve, east of Broadway Channel and north of Intrepid Waters. It is affixed to a manatee caution sign’s piling in Big Hickory Bay. The mouth of the Imperial River is approximately 2.1 km south and is the closest tributary. The substrate is a mixture of sand and silt with no bottom vegetation. Mangroves dominate the nearby shorelines. The average depth at this location at mean high-water line is 1.4 meters. This location is near an active rookery island and north of a shoal grass bed.
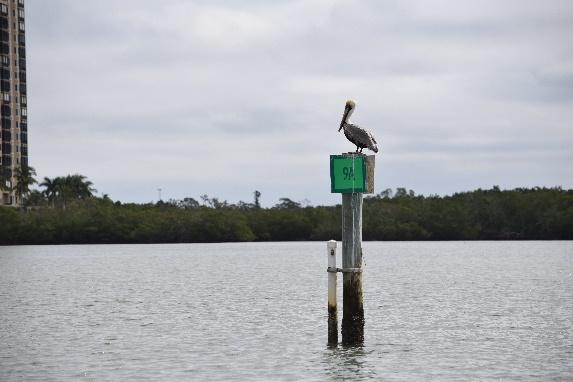
EB04 - EB04(Hendry & Mullock Creeks) is located in northeast Estero Bay, downstream of the confluence of Hendry Creek and Mullock Creek where they empty into Estero Bay, an area called Rocky Bay. The sonde is affixed to a navigational piling maintained by Lee County, green channel marker #9. The mouth of Hendry & Mullock Creeks are approximately 1.0 km to the northeast of the sonde’s location. The average depth at MHW is approximately 1.45 meters. Tides are mixed semidiurnal and range from 0.89m to 1.34m. Salinities range from 1 ppt to 32 ppt and fluctuate daily with tides, wind, rainfall, and freshwater discharge. The substrate within the channel is muddy sand, and beyond the channel lies a long oyster bar. Directly beneath the deployment tube lie subtidal oysters. Mature red and black mangrove forests dominate the nearby banks of the preserve. Much of the watersheds lie within the wetlands protected in Estero Bay Preserve State Park, including mangrove forests as well as some areas of salt marsh. Further upstream, the natural vegetation is hydric pine, cypress, and scrubby flatwoods.
| Station code |
Name |
Dates available |
| EB01* |
EB01 |
07/14/2004 to 12/31/2022 |
| EB01B |
EB01B |
01/01/2024 to 03/31/2026 |
| EB02 |
EB02 |
07/14/2004 to 03/31/2026 |
| EB03 |
EB03 |
11/23/2004 to 03/31/2026 |
| EB04 |
EB04 |
05/11/2021 to 03/31/2026 |
Aquatic Preserve Description
Northeast Florida Aquatic Preserve (NEAP), or the Nassau River-St. Johns River Marshes Aquatic Preserve, was designated an aquatic preserve on November 24, 1969 to protect the Nassau Sound area marshes and waters. Nassau River-St. Johns River Marshes and Fort Clinch AP are in the northeastern part of the state along the Atlantic intracoastal waters. This area consists 69,000 acres of saltmarsh estuary with numerous interconnecting tidal creeks, rivers and channels with some small tree islands. Fort Clinch Aquatic Preserve (7,600 acres) provides an aesthetic buffer for the state park as it borders extensive saltmarsh along Amelia Island. There is currently one active station collecting data continuously, Edwards Creek. Historically, continuous data was collected at Clapboard Creek, Kingsley Dock, Lofton Creek, and Nassau River until 2011.
Datalogger Site Description
Clapboard Creek (NECC) - The Clapboard Dock site is located north of Heckscher Dr, midway between 9A and the St Johns River Ferry. Clapboard Creek is a large body of water situated between Brown's Creek and Cedar Point Creek. It is relatively wide-open area with small islands, finger creeks, sand bars, oyster beds, and some deep holes. There is also a westerly section known as Little Clapboard Creek. Clapboard Creek sonde was deployed in September 2004 and remained in continuous service until 2011.
Kingsley Dock (NEKD) - The Kingsley Dock site is located at the Kingsley Plantation boat dock within the NPS Timucuan Ecological and Historic Preserve on Ft. George Island. Surrounding land use is predominantly natural with very limited residential development on neighboring Islands. This site and surrounding surface waters carry the dual designation of Class II Shellfish Harvesting Waters and Outstanding Florida Waters. The average depth at this site is 4.0m with a tidal range of 1.54m; the substrate type is muddy sand, with emergent oyster beds lining the immediate shoreline. Data collection began in March 2004 and remained in continuous service up until 2011.
Lofton Creek (NELC) - The Lofton Creek site is located just inside the mouth of creek from its confluence with the Nassau River. Lofton Creek is one of the largest tributaries of the Nassau River and transitions from sawgrass dominated cypress swamps to spartina and needlerush marshes within the aquatic preserve. The creek is mostly border by rural home sites with septic systems though large planned communities are being developed along the eastern bank. The meandering bends in the creeks yield steep banks and shoals with sparse oyster growth along the more saline stretches. Lofton Creek sonde was installed July of 2005 and remained in continuous service until 2011.
Lofton Creek (NELN) - The Lofton Creek site is located just inside the mouth of creek from its confluence with the Nassau River. Lofton Creek is one of the largest tributaries of the Nassau River and transitions from sawgrass dominated cypress swamps to spartina and needlerush marshes within the aquatic preserve. The creek is mostly border by rural home sites with septic systems though large planned communities are being developed along the eastern bank. The meandering bends in the creeks yield steep banks and shoals with sparse oyster growth along the more saline stretches. This station is located about 10 miles north upstream of the historical NELC station. Though the site characteristics are similar, water quality characteristics at this site may differ from the historical Lofton Creek site.
Half Moon (NEHM) - The Nassau River (NR) site is located at (30⁰ 33’5.14" N 81⁰ 36’51.24" W) just east of US Highway 17 and the border of the aquatic preserve. This stretch of river is much narrower and fresher than the lower reaches. The marshes are mostly needlerush dominated and only barnacles are present since the water is too fresh for oysters. The water is dark stained with tannins from the swamps and marshes to the west of Highway 17 and I-95.
Edwards Creek (NEEC) - The Edwards dock site is located in the northern portion of Betz Tiger Point Preserve (30.50333, -81.49472), where surrounding surface waters carry the designation of Nassau Valley State Reserve Outstanding Florida Water. Edwards Creek is neighbored by two smaller creek systems, Starrett and Samples Creek, both of which are filled by the larger-bodied Pumpkin Hill Creek. The area is a mixture of salt marshes along with pine flatwoods and maritime hammock. Substrate type consists of mudflats with emergent patches of oyster beds. This station began collecting continuous data (15-minute intervals) using an EXO2 datasonde in November of 2020.
Crane Island (NECI) - The Crane Island station is located within the Fort Clinch Aquatic Preserve within the Amelia River (30.614⁰, -81.479⁰) and is our most Northeastern site in Florida. It is affixed to a public dock available through the Crane Island Community. This tributary flows North into the St. Marys River, which then leads to Cumberland Sound, flowing out to the Atlantic Ocean through a dredged inlet channel flanked by jetties. The western edge of the preserve borders extensive salt marsh along Amelia Island, and the preserve extends to the Florida-Georgia state line.
| Station code |
Name |
Dates available |
| NECC* |
Clapboard Creek |
09/17/2004 to 05/31/2011 |
| NEKD* |
Kingsley Plantation |
03/01/2004 to 05/31/2011 |
| NELC* |
Lofton Creek |
07/01/2005 to 05/31/2011 |
| NELN |
Lofton Creek |
04/07/2023 to 03/31/2026 |
| NENR* |
Nassau River |
08/01/2009 to 05/31/2011 |
| NEHM |
Half Moon |
04/09/2022 to 03/31/2026 |
| NEEC |
Edwards Creek |
11/20/2020 to 03/31/2026 |
| NECI |
Crane Island |
10/24/2023 to 03/31/2026 |
Aquatic Preserve Description
Yellow River AP is located in south-central Santa Rosa County in the western Florida Panhandle. The aquatic preserve’s boundary extends from Highway 87, west on the Yellow River and west to Bay Point on Blackwater Bay. From Bay Point, the aquatic preserve boundary stretches southward to White Point on East Bay, and then extends eastward to Escribano Point to the mouth of Blackwater Bay. There is currently one active station collecting data continuously. Much of the habitat, which includes seagrass, is declining due to point and non-point pollution sources impacting Blackwater and East bays which is causing a reduction in water quality from decreased light penetration. The main objective for the project is to improve the water quality in the Pensacola Bay Watershed by providing long term monitoring that quantifies the spatial/temporal variability and trends, both seasonally and as a function of tidal forcing, of selected abiotic parameters.
Datalogger Site Description
YRMAP1 - YRMAP1 is located southeast of the two population centers: the city of Milton and the village of Bagdad. The position of this station allows for comparisons between existing monitoring from other organizations stations and gets an overall reading in the estuary from the output from the Yellow River and saline fluctuations from East Bay. Several wastewater facilities discharge treated effluent into the system north of YRMAP. Additionally, the degraded septic tanks in nearby towns and within YRMAP vicinity ultimately affect the water quality. The sonde is contained within a housing pipe mounted horizontally on a cement base elevated off the seafloor. YSI 6600 EDS data sondes have been continuously operated (data collection interval: 15 minutes) at the Yellow River Marsh site since January 2015.
| Station code |
Name |
Dates available |
| YRMAP1 |
YRMAP1 |
01/02/2015 to 03/31/2026 |
Aquatic Preserve Description
The Terra Ceia Aquatic Preserve is located entirely within northwestern Manatee County. The preserve encompasses several inlets of southeastern Tampa Bay, as well as much of the southeastern Tampa Bay shoreline. The AP is central to the Bradenton/St. Petersburg/Tampa area. It’s northern boundary begins just south of the mouth of Little Redfish Creek at Port Manatee. The southern boundary lies between the mouths of Terra Ceia Bay and the Manatee River at Emerson Point on Snead Island and extends northwesterly from these points. Terra Ceia AP is comprised of 24,900 acres of open water, inlet bays, and tidally influenced creeks and rivers. It contains a diverse variety of natural communities, including seagrass, mangroves, salt marsh, tidal flats, hardbottom, oyster bars and clam beds. The area provides a unique opportunity to study the effects of climate change regarding genetic adaptation, diversity, interaction, dominance shifts due to parasite/disease interaction, and changes in reproduction trends. Terra Ceia Aquatic Preserve was designated as an Outstanding Florida Water on May 22, 1986.
Datalogger Site Description
Bishop Harbor (TCBH) - Data sonde deployment began at this site in April 2008. This station is located at the mouth of Bishop Harbor. This location was chosen, because Bishop Harbor was one of the least-developed harbors along the Tampa Bay Shoreline.
Frog Creek (TCFC) - Data sonde deployment began at this site in August 2008. The Frog Creek Station was selected because it was one of the last remaining tidal creeks in the Tampa Bay Area that had not been hydrologically altered to a great extent. It had a distinct salinity gradient, and much of the creek had natural bathymetry and vegetated shorelines. This site was selected for possible comparison with more developed tidal creek systems.
| Station code |
Name |
Dates available |
| TCBH* |
Bishop Harbor |
04/24/2008 to 03/03/2009 |
| TCFC* |
Frog Creek |
08/06/2008 to 02/26/2009 |
Aquatic Preserve Description
Biscayne Bay Aquatic Preserves (BBAP) is comprised of two aquatic preserves consisting of 68,770 acres of state managed lands, which are primarily submerged lands and seagrass ecosystems. The majority of BBAP is within Miami-Dade County, the most populous county in the state of Florida. Pollution impacts were a primary driver in the establishment of BBAP; following protection, resources rebounded tremendously after decades of habitat loss and destruction. However, in recent years due to increasing and cumulative stressors, decreases in water quality and collapse of seagrass ecosystems have been observed, especially in the northern section of Biscayne Bay most closely associated with high population densities. Stations were chosen in an array to understand the relationship between the Little River flow into the Basin and across the large, central shoal containing seagrass habitat. YSI datasondes are deployed monthly at three locations and data is collected in 15-minute intervals.
Datalogger Site Description
Miami River Downstream Wagner Creek (BBMRDW) - BBMRDW is located about
1.5-miles upriver from the mouth of the Miami River, downriver of the intersection with
Wagner Creek, which is suspected to be a major source of nutrients and pollutants
(such as heavy metals). The Miami River outflows into the Rickenbacker Basin shoal
and then out the Government Cut inlet which leads out to an offshore coral reef tract.
The site is tidally influenced in the wet season and well mixed in the dry season. Water
quality in the area is poor with nutrient sources coming from urban run-off and
development. There is also significant amount of cargo ship traffic through the Miami
River. YSI EXO2 datasondes have been swapped monthly at this site since March
2021.
Miami River Salinity Control Station (BBRMSC) - BBMRSC is located about 9.1-
miles upriver from the mouth of the Miami River, downriver of a salinity control structure.
The potential nutrient and pollutant sources are from urban run-off. The Miami River
outflows into the Rickenbacker Basin shoal and then out the Government Cut inlet
which leads out to an offshore coral reef tract. The site is tidally influenced in the wet
season and well mixed in the dry season. Freshwater inflow from the salinity control
structure varies depending on management actions, rainfall, and timed releases of Lake
Okeechobee water. YSI EXO2 datasondes have been swapped monthly at this site
since March 2021.
Little River (BBLR03) - BBLR03 is about 0.5 miles upriver from the mouth of the Little
River and located between the mouth and a salinity control structure. The datasonde is
situated mid-column where it picks up the upriver freshwater discharged by the salinity
control structure and the saline bay water that is drawn in at high tide. The Little River is
suspected to be a major source of nutrients and other pollutants into the Basin and
generally has poorer water quality than the bay sites. Freshwater inflow is determined
by the salinity control structure and varies depending on management actions, rainfall,
and timed releases of Lake Okeechobee water. Starting April 2019, two YSI 6920
sondes were operating and swapped in the River until March 2020. Currently, YSI
EXO2 sondes are swapped monthly.
Tuttle Basin (BBBB14) - BBBB14 is in the northwest section of the Tuttle Basin shoal.
The site was highly impacted by the seagrass die-off event in the northern portion of the
shoal where full loss of the prior seagrass cover was observed. The seagrass loss event
occurred as an edge-in effect, especially from the northern edge. BBBB14 was likely
one of the earlier areas to switch to a macroalgal dominated bed lacking seagrass from
previous Syringodium filiforme, manatee grass, dominance in the area. The bottom
habitat is currently dominated by Halimeda discoidea and the sediment is largely made
up of Halimeda hash (remains of calcified algal discs) at the surface in a muddy matrix.
Starting January 2019, a YSI 6600 datasonde was operating in the Basin until April
2020. Currently, YSI EXO2 sondes are swapped monthly.
Tuttle Basin (BBJT71) - BBJT71 is in the southeast section of the Tuttle Basin shoal,
further from the Little River than BBBB14. This site was chosen to observe the area
where some seagrass was still present at the initiation of the project. The southeast
interior section of the shoal in the Basin was previously fully covered by a dense refugia
of seagrasses, with the dominant species being Syringodium filiforme. While there is
some seagrass remaining at this site, it is very patchy and sparse. This site lost
seagrass coverage later than BBBB14. YSI EXO2 datasondes have been swapped
monthly in the southeast corner of the Basin since March 2019.
Rickenbacker Basin (BBMRRB) - BBMRRB is located at the confluence point of the Miami River, the Intra-Coastal Waterway, and Fisherman’s Channel (Port of Miami) where the seagrass shoal habitat begins in the Northwest corner of the Rickenbacker Basin. This site faces high impact potential due to cruise ship and cargo port activity, heavy boat traffic, and discharge from the Miami River, which is a known source of nutrients and other pollutants. Tidal flushing of this area through nearby Government Cut and other inlets leads to high connectivity to the offshore coral reef tract. The datasonde is situated about 1-ft from bottom, within a PVC mount that is attached to an FWC ATON piling with stainless steel brackets. YSI EXO2 datasondes have been swapped monthly at this site since January 2022.
Critical Wildlife Area (BBCWA4) - BBCWA4 is within a seagrass shoal located at the edge of the Bill Sadowski Critical Wildlife Area (CWA), which is a no-entry/no-take area in Biscayne Bay. The CWA is an area of significant refuge for many marine organisms, including birds, seagrass, sponges, fish and manatees and was established due to continual human disturbances interfering with the conservation of these protected species. The datasonde is situated about 1-ft from bottom, within a PVC mount that is attached to an FWC ATON piling with stainless steel brackets. YSI EXO2 datasondes have been swapped monthly at this site since January 2022.
| Station code |
Name |
Dates available |
| BBLR03 |
Little River (LR03) |
04/19/2019 to 04/01/2026 |
| BBBB14 |
Tuttle Basin (BB14) |
01/18/2019 to 04/07/2026 |
| BBJT71 |
Tuttle Basin (JT71) |
03/05/2019 to 03/26/2025 |
| BBMRSC |
Miami River Salinity Control Station (BBMRSC) |
03/31/2021 to 01/08/2026 |
| BBMRDW |
Miami River Downstream Wagner Creek (BBMRDW) |
03/31/2021 to 04/01/2026 |
| BBMRRB |
Miami River Rickenbacker Basin (BBMRRB) |
01/01/2022 to 04/07/2026 |
| BBCWA4 |
Critical Wildlife Area (BBCWA4) |
01/01/2022 to 04/06/2026 |
Aquatic Preserve Description
Tomoka Marsh Aquatic Preserve (TMAP) is located on the northeast coast in Flagler and Volusia counties, between the towns of Ormond Beach and Flagler Beach. Portions of these counties range in character from rural to highly developed. TMAP was established in 1969 and is an estuarine system comprised of approximately 3,000 acres including more than 4.5 miles of the NE flowing Tomoka River, 10 miles of the Halifax River (ICW), 8 miles of Bulow Creek, Smith Creek (ICW), the 376-acre Tomoka basin, saltwater marshes and spoil islands. The mixing of saltwater from the Atlantic Ocean is introduced through the Matanzas inlet 28 miles to the north and the Ponce DeLeon Inlet 24 miles to the south, with freshwater from the Tomoka River, Bulow Creek and the upper Halifax River drainage basin, that which creates the estuary and sustains the saltwater marshes. TMAP’s wetlands were severely altered in the 50’s and 60’s by dragline mosquito ditching that greatly reduced the wetland area, altered the hydrology and lessened the ecosystem. Some of these wetlands have been restored as part of ongoing restoration efforts. TMAP has never had a continuous water quality station, the first EXO2 datasonde site TMGR was established and deployed 01/08/2021. The goals of this program are to establish baseline water quality; evaluate daily, seasonal and long-term trends.
Datalogger Site Description
Gamble Rogers (TMGR) - Station TMGR is located near the northern boundary of the TMAP within the southern portion of Smith Creek (ICW) just before it converges with the Halifax River (ICW). TMGR (29.43636, -81.11181) is visible from the Gamble Rogers boat ramp and kayak launch area and can be accessed by kayak or small boat. This area exhibits estuarine characteristics with freshwater inputs from the Halifax river drainage basin emptying through the marsh and into the tidal influenced Smith Creek. The site is adjacent to a 22 acres dragline ditch restoration project completed by SJRWMD in 2019, so the area is in its second year of recovery. This marsh, river confluence area where the sonde is located is comprised of mud flats, oyster beds, mangrove lined shorelines and saltwater marsh plant communities. The area provides an important nursery area for fish, shrimp, and crab caught commercially and recreationally as well as a popular birding and kayak destination for visitors.
| Station code |
Name |
Dates available |
| TMGR |
Gamble Rogers |
01/08/2021 to 06/30/2022 |
Aquatic Preserve Description
Guana River Marsh Aquatic Preserve (GMAP), located within the boundaries of GTM Research Reserve, is unusual because it includes uplands. Nearly 12,000 acres of uplands were purchased by the state of Florida in 1984 because of their environmental sensitivity and to protect several species of endangered and threatened plants and animals. GMAP has an abundance of habitats including salt marshes, a large artificial freshwater-to-brackish water lagoon, open ocean, and a complete cross-section of a relatively undisturbed barrier island. This diversity provides habitat for a wide variety of resident and migratory wildlife. Bird rookeries, including a sizable breeding population of the endangered wood stork, are found within the preserve. The preserve also contains 13 miles of beach with high dunes (35-40 feet), stabilized by native coastal vegetation, that provide breeding and nesting habitat for sea turtles and ground-nesting shorebirds such as the threatened least tern. In 1957, an earthen dam was constructed across the Guana River creating Guana Lake. This wetland is approximately 2,400 acres, and provides both open water and marsh habitats. The drainage basin includes approximately 7,800 acres extending from the dam 17 miles north into Jacksonville Beach.
Datalogger Site Description
Mickler Station (GMMK) - The Micklers station is located at Micklers Weir, a water control structure at the head of Guana Lake just south of the intersection of Florida A1A and Mickler Road. The sonde is housed in a PVC tube that is attached to a boardwalk on the south side of the weir. Freshwater flows into the preserve through this single point; however, saltwater influxes can occur depending on the Florida Fish and Wildlife Conservation Commission’s (FWC) management of the Guana Dam, which is located at the southern end of Guana Lake. The area is relatively shallow, and its substrate consists of soft, muddy sand that is easily disturbed. There is an abundance of submerged aquatic vegetation, including invasive hydrilla (Hydrilla verticillata) and coontail (Ceratophyllum demersum). Invasive macrophytes water hyacinth (Eichhornia crassipes) and water lettuce (Pistia stratiotes) often float into and over the weir catch, causing vegetation buildup. This buildup is occasionally cleared and can be affected by storms and high rain events.
| Station code |
Name |
Dates available |
| GMMK |
Mickler Station |
01/01/2021 to 03/31/2026 |
Aquatic Preserve Description
Gasparilla Sound-Charlotte Harbor Aquatic Preserve (CHAP), located in Charlotte and Lee Counties, was designated as an aquatic preserve in 1979. The aquatic preserve comprises approximately 84,500 acres and includes Gasparilla Sound, Charlotte Harbor, and the mouths of the Peace and Myakka rivers. Fresh water from the Peace and Myakka rivers mixes with saltwater coming through Boca Grande Pass from the Gulf of Mexico. The Charlotte Harbor (CHWW1) site was selected to monitor water quality conditions along the West Wall of Charlotte Harbor. Currently, there is no other continuous water quality collected in this area. Eight different water quality parameters are collected every 15 minutes at this station.
Datalogger Site Description
Charlotte Harbor West Wall 1 (CHWW1) - Station CHWW1 is located along the mangrove shoreline of Charlotte Harbor often referred to as the West Wall. It is approximately .40 miles east of the mouth of Trout Creek. The site is located on a DEP DEAR permitted piling and sign. Deployment began in March 2021, although DEAR had originally established this site in 2008 and collected data for one year. This monitoring site is influenced by the Myakka and Peace rivers located to the north. The substrate is predominately muddy sand and there is seagrass (Halodule wrightii and Thalassia testudium) adjacent. This station is located near the end of the CHAP established seagrass monitoring transect (MC05) and is approximately 1.5m deep at mid tide.
Charlotte Harbor East Wall 1 (CHEW1) - Station CHEW1 is on the east side of Charlotte Harbor often referred to as the East Wall. The site is located on a Charlotte County permitted piling with a “Seagrass Prop Scarring Prohibited” sign adjacent to the Pirate Harbor Community access channel. At 0.9 miles west from land, the depth at the site is approximately 2.1m deep at mid tide. The sediment consists of muddy sand and there is seagrass (Halodule wrightii and Thalassia testudium) adjacent. This location can capture waters from Boca Grande Pass on an incoming tide, as well as potential waters from Matlacha Pass on events with strong incoming tides, excessive flows, and high winds from the south. There are CHAP seagrass monitoring sites located nearby, as well as an oyster restoration site (deployed in May 2022). With the current macroalgae bloom occurring along the East Wall, this data will be valuable in describing water temperatures, salinities, and dissolved oxygen values associated with blooms and decomposition events.
| Station code |
Name |
Dates available |
| CHWW1 |
West Wall 1 |
05/04/2021 to 04/15/2026 |
| CHEW1 |
East Wall 1 |
01/24/2024 to 04/15/2026 |
Aquatic Preserve Description
There are two Aquatic Preserves (AP) located within the Florida Keys: Lignumvitae Key Aquatic Preserve (FKLK) in Islamorada, between Upper and Lower Matecumbe Key and Coupon Bight Aquatic Preserve (FKCB) in the southern portion of Big Pine Key. Both are located in Monroe County and fall completely within the boundaries of the Florida Keys National Marine Sanctuary (FKNMS). Water quality impacts, which are influenced by a variety of socio-environmental and spatial interrelationships, are complex process to conceptualize. However, the FKNMS Water Quality Protection Program, co-chaired by the Florida Department of Environmental Protection and the U.S. Environmental Protection Agency, and in conjunction with other agencies and organizations, is actively working to identify impairments, develop plans to resolve those issues, and finding funding to implement those plans. Some examples include the near 100% septic-to-sewer conversion, an extensive canal restoration program, and storm water improvement projects. While an extensive quarterly water quality monitoring program was implemented in the 1990s throughout the Keys, it has not been until recently that continuous water quality monitoring has been feasible. DEP’s Office of Resilience and Coastal Protection staff have deployed data sondes that collect data in 15-minute intervals. Parameters measurements include temperature, salinity/conductivity, dissolved oxygen, pH, turbidity, and chlorophyll.
Datalogger Site Description
Lignumvitae Key (FKLK) - The sonde is located at the Lignumvitae Key Botanical State Park dock in Florida Bay. These waters are 1.5-miles SES of Everglades National Park boundaries and 1.4-miles NWN of the US1/SR5 bridge over Indian Key Channel. The Great Everglades Ecosystem, as well as oceanside eddy currents, are known to influence the water quality in this area. This site was established in October 2021.
Coupon Bight (FKCB) - The sonde is located at the mouth of Newfound Harbor Channel just beyond Little Munson Island. This site is 1.5-miles due south of the southernmost tip of Ramrod Key and 0.9-miles WNW of the first coral head at Newfound Harbor Sanctuary Preservation Area. The water quality in this area is known to be tidally influenced, located at the main exchange of water occurring between The Backcountry and Hawk Channel. This site was established in October 2023.
Coupon Bight - Tidal Investigation (FKTCB) - This sonde was located in Coupon Bight Aquatic Preserve horizontally deployed on a 12-in height cinder block. The site is near the channel to Long Beach and is the furthest extent of the coral formations located within Coupon Bight. Due to Coupon Bight having a single mouth, the water quality in the Bight is tidally influenced. This data sonde station was intended to investigate the impacts of that tidal influence in a location that historically hosted robust coral growth. It was established in August of 2021 and removed November 2024.
| Station code |
Name |
Dates available |
| FKLK |
Lignumvitae Key |
01/01/2024 to 12/31/2025 |
| FKCB |
Coupon Bight |
01/01/2024 to 12/31/2025 |
| FKTCB* |
Coupon Bight - Tidal Investigation |
09/16/2021 to 12/31/2022
|
Aquatic Preserve Description
The Nature Coast Aquatic Preserve encompasses 800 square miles of coastal waters covering Citrus, Hernando counties. NCAP is a mosaic of salt marshes, mangroves, seagrass meadows, sponge beds, and hard-bottom habitats, and is influenced by multiple spring-fed rivers. The karst geology and spring-fed rivers are key influences on the ecosystems and the wildlife that depends on them, including sea turtles and manatees. The NCAP protects nearly 400,000 acres of seagrass that support valuable working waterfront industries, including fisheries, seafood production and ecotourism. Kayaking, boating, fishing and scalloping are popular recreational opportunities within the NCAP.
Datalogger Site Description
Nature Coast Bayport Station (NCBP) - The Bayport station is located at the Bayport Park fishing pier at the mouth of the Weeki Wachee River. The sonde is housed in a PVC tube attached to the pier at the western end. Fresh water flows into the preserve from the Weeki Wachee River and mixes with salt water from the Gulf creating brackish conditions. The area is shallow and tidally influenced. The sediment is sand mixed with silt and oysters grow along the pilings of the pier. There is no vegetation in the vicinity of the station, however, sparse seagrasses like Thalassia testudinum and Halodule wrightii grow in Weeki Wachee bay.
| Station code |
Name |
Dates available |
| NCBP |
Bayport |
03/18/2025 to 04/02/2026 |